
Defence maintenance effectiveness is the degree to which maintenance keeps military equipment safe, available, reliable, and ready for assigned missions while using people, time, parts, and money responsibly. It is best measured with a balanced set of readiness, reliability, repair-time, cost, safety, and supply indicators—not by counting completed work orders alone. The U.S. Government Accountability Office (GAO) has repeatedly identified maintenance, spare-parts availability, and other sustainment constraints as factors that can limit military readiness. A useful measurement system therefore connects maintenance activity to operational outcomes, establishes clear data definitions, compares results with targets and trends, and checks that apparent gains do not come at the expense of safety or future equipment health.
Defence Maintenance Effectiveness Measures Operational Readiness
Effectiveness asks whether maintenance achieves the required outcome; efficiency asks how economically or quickly it does so. In defence, the outcome is not simply a serviceable vehicle or aircraft on a workshop floor. It is a safe, properly configured asset available when and where the force needs it. The U.S. Department of Defense (DoD) uses mission-capable measures to describe whether aircraft can perform at least one assigned mission, while fully mission-capable measures indicate ability to perform all assigned missions. These measures illustrate why readiness must be interpreted in relation to mission requirements rather than as a standalone percentage.
There is no single internationally applicable formula for maintenance effectiveness. Definitions vary across services, platforms, and reporting systems, so leaders should document the population, time period, exclusions, and operational standard behind every metric. This is particularly important when comparing units: a fleet with older equipment, different operating tempo, or more demanding missions may not be meaningfully comparable with a fleet that has different conditions.
Readiness and availability
Availability measures the share of time an asset is ready for use, while operational readiness measures whether it can meet a specified mission standard. One basic availability measure is operationally available asset-hours divided by required asset-hours over a stated period. It should be reported alongside the number of assets required, because a high percentage of a small or insufficient fleet may still leave a unit unable to meet its task.
For example, an aircraft can be mechanically serviceable but unavailable for a mission because it lacks a qualified crew, approved configuration, or required mission equipment. Conversely, a maintenance-focused availability figure may exclude those non-maintenance constraints. Reports should therefore distinguish maintenance availability from total mission readiness and identify the causes of non-availability. GAO reporting on U.S. weapon systems has highlighted persistent readiness challenges across multiple fleets, demonstrating why aggregate readiness figures need platform-level and cause-level analysis.
Reliability and repeat faults
Reliability describes how consistently equipment performs without failure for a defined operating period or exposure, such as flight hours, miles, engine cycles, or operating days. Common measures include mean time between failures and failure rates per unit of exposure. A useful effectiveness assessment tracks not only whether a fault was repaired, but whether the repair resolved the underlying problem and whether the same fault returned.
Repeat-fault rates can reveal incomplete diagnosis, poor-quality repair, unsuitable parts, or a recurring design problem. They should be interpreted with the equipment’s age and operating intensity in view. A declining number of reported defects may indicate improved reliability, but it can also reflect under-reporting or reduced use. Maintenance records should therefore be checked against operational logs, inspections, and user reports.
Safety and mission assurance
Safety is a non-negotiable dimension of effectiveness. A repair that restores availability but fails technical orders, airworthiness requirements, configuration control, or quality checks is not an effective outcome. Relevant indicators include maintenance-related mishaps, inspection findings, deferred defects, repeat discrepancies, and compliance with mandatory technical instructions.
Leading indicators—such as overdue inspections, unresolved safety-critical defects, or incomplete quality-assurance checks—can provide warning before an incident occurs. They should complement lagging indicators such as accidents and equipment damage. Where reporting systems classify events differently, leaders should avoid cross-unit comparisons until definitions and thresholds have been reconciled.
Defence Maintenance Effectiveness Tracks Time, Capacity, and Cost
Readiness describes the result, but time, workload, and cost help explain how maintenance produces it. These measures identify bottlenecks, support resource decisions, and show whether improved availability is sustainable. The bridge between outcome and process matters: a unit may raise readiness temporarily by consuming extra parts, extending shifts, or deferring lower-priority work, while creating future cost or risk.
Repair time and maintenance workload
Turnaround time is the elapsed time from an agreed start point—such as fault reporting or induction into maintenance—to return to service. It should be separated into diagnostic, waiting-for-parts, repair, inspection, and administrative time. Mean time to repair can summarize completed jobs, but medians and percentile measures are often more informative because a small number of very long repairs can distort the average.
The U.S. DoD’s public aircraft readiness reporting has documented how maintenance delays and supply constraints affect mission-capable outcomes. For an individual unit, a useful dashboard can show the share of downtime attributable to labor, parts, technical data, facilities, or external repair. This decomposition helps managers target the actual constraint rather than treating all downtime as a workshop productivity issue.
Backlog, capacity, and workforce
Maintenance backlog is the stock of approved work not yet completed. Its size alone is insufficient: an effective backlog measure distinguishes safety-critical and readiness-critical jobs from routine work and records the age of each item. A rising backlog, growing average age, or increasing share of overdue inspections can signal that demand exceeds available capacity.
Workforce indicators may include authorized versus filled technical positions, qualifications, training currency, overtime, and productive maintenance hours. These should be read alongside output and quality, not used as simple productivity rankings. In its sustainment reviews, GAO has emphasized the importance of reliable cost and performance information for managing weapon-system support; incomplete or inconsistent records can make it difficult to determine whether staffing or contractor support is producing the intended readiness outcome.
Maintenance cost and lifecycle value
Cost measures may include maintenance cost per operating hour, cost per mission-ready asset, parts expenditure, contractor support, and cost of unscheduled repairs. Comparisons need consistent accounting boundaries and exposure measures. For example, comparing annual costs without adjusting for flying hours, vehicle mileage, fleet size, or asset age can mislead decision-makers.
Lifecycle value asks whether maintenance spending preserves capability over the service life of the system, not merely whether this year’s budget was spent efficiently. The U.S. Government Accountability Office has reported that sustainment is a substantial component of the total cost of many major weapon systems, making early visibility of long-term support costs important. Cost reductions should therefore be tested against readiness, reliability, safety, and deferred-maintenance trends before being treated as effectiveness gains.
Defence Maintenance Effectiveness Depends on Supply and Data Quality
Maintenance outcomes depend on more than technicians and repair procedures. Parts, technical information, tools, facilities, and reliable records all shape the time required to restore equipment. Supply and data measures explain why an asset is waiting and whether reported performance can be trusted.
Parts availability and supply delays
Supply effectiveness measures whether the right part reaches the right maintenance location when needed. Useful indicators include requisition fill rate, backorder age, demand satisfaction, repairable-item turnaround, and the proportion of downtime caused by unavailable parts. A high fill rate can still conceal poor performance if it is calculated only for routine items or excludes urgent demands, so definitions should specify the demand population and priority categories.
GAO has repeatedly found that spare-parts shortages and supply-chain weaknesses can constrain U.S. military readiness. A practical example is a fleet whose aircraft are otherwise repairable but remain grounded while a component is unavailable. In that case, measuring workshop labor alone would misidentify the problem; linking maintenance records to requisition and inventory data reveals the supply contribution to downtime.
Preventive and predictive maintenance
Preventive maintenance is scheduled by time, usage, or inspection criteria to reduce the likelihood of failure. Predictive maintenance uses condition data—such as vibration, temperature, oil analysis, or fault-code patterns—to estimate when intervention may be needed. Neither approach is effective simply because more inspections or sensors are used: the test is whether they reduce consequential failures and unplanned downtime without creating excessive servicing or false alarms.
Measures can include the proportion of work that is planned, failures occurring between scheduled services, maintenance-induced defects, and the accuracy of predicted component life. Results should be compared with a baseline and adjusted for usage and operating environment. A rising planned-work share may indicate improved control, but it is not proof of better readiness if unscheduled failures or inspection deferrals also rise.
Data integrity and metric governance
Metric governance is the practice of defining indicators consistently, assigning accountable data owners, and validating source records. Each metric should state its formula, unit of analysis, reporting interval, inclusion rules, and intended decision. For example, “availability” should specify whether it is measured by asset count, asset-hours, or mission demand, and whether scheduled maintenance is included.
Data-quality checks should identify missing timestamps, duplicate work orders, inconsistent fault codes, and changes in reporting behavior. Analysts should preserve the distinction between correlation and causation: a unit’s readiness may improve after a maintenance initiative, but changes in operating tempo, fleet composition, weather, or mission assignment may also explain the result. Independent audits and trend reviews help validate whether the apparent improvement is real.
Defence Maintenance Effectiveness Uses a Balanced Measurement System
A balanced system combines outcome, process, resource, and risk indicators. It avoids rewarding one narrow target in ways that undermine the wider mission—for example, reducing reported repair time by closing work orders before equipment has passed inspection. The dashboard should be small enough to support decisions but broad enough to expose trade-offs.
Select indicators tied to mission needs
Start with the capability the force must provide, then select measures that show whether maintenance supports it. A helicopter unit may prioritize aircraft availability for assigned missions, safety-critical inspection compliance, repeat faults, and parts-driven downtime. A depot may instead focus on overhaul delivery, turnaround time, quality escapes, and cost variance. The same metric set should not be imposed on every echelon without regard to its role.
-
Outcome: mission-capable or operationally available asset-hours.
-
Reliability: failures per operating hour, distance, or cycle, plus repeat-fault rate.
-
Process: repair turnaround time, planned-work share, and backlog age.
-
Supply: parts fill rate and downtime attributable to supply delays.
-
Resources and risk: cost per exposure unit, qualified workforce coverage, and safety or quality findings.
Set baselines, targets, and comparison rules
A baseline establishes current performance before a change is introduced. Targets should reflect mission demand, technical limits, approved policy, and realistic resource assumptions rather than arbitrary pressure to improve a percentage. Comparisons should account for fleet age, usage, operating conditions, configuration, and reporting practices. Where those factors cannot be normalized, present the data as contextual evidence rather than a league table.
Targets should include thresholds for unacceptable risk as well as desired improvement. For instance, a unit may seek shorter average repair time while maintaining a ceiling for repeat faults and zero tolerance for overdue safety-critical inspections. This makes trade-offs visible and discourages gaming.
Review trends and investigate causes
A dashboard is a starting point for inquiry, not a substitute for it. Review trends over an appropriate period, examine outliers, and trace changes to work orders, parts records, and operational logs. Control charts or simple monthly trend graphs can help distinguish sustained change from ordinary fluctuation; a stacked downtime chart can show how much delay comes from repair, parts, waiting, or inspection.
When performance shifts, teams should test likely causes before changing policy or staffing. A rise in unscheduled failures may follow higher operating tempo, an environmental stressor, a component batch issue, or a maintenance practice change. Root-cause analysis, engineering input, and frontline technician feedback help ensure that corrective action addresses the mechanism rather than only the reported symptom.
Defence Maintenance Effectiveness Improves Through Applied Examples
Aircraft readiness reporting
GAO’s reviews of U.S. military aircraft readiness provide a real-world illustration of the difference between maintenance output and mission outcome. Aircraft can be unavailable because of maintenance, supply, or other support constraints, and service-wide averages can conceal substantial variation among aircraft types. A sound local analysis therefore pairs mission-capable rates with the reasons aircraft are not capable, the duration of each constraint, and trends in repeat failures and parts delays.
Depot and overhaul performance
For a depot, the immediate output may be completed overhauls, but effectiveness also depends on delivery reliability, technical quality, cost, and whether returned equipment meets operational needs. Measuring only the number of units completed can reward quick processing while overlooking late deliveries or defects found after return to service. A balanced scorecard would pair delivery against schedule with rework, quality escapes, cost variance, and the downstream availability of the repaired fleet.
A practical dashboard example
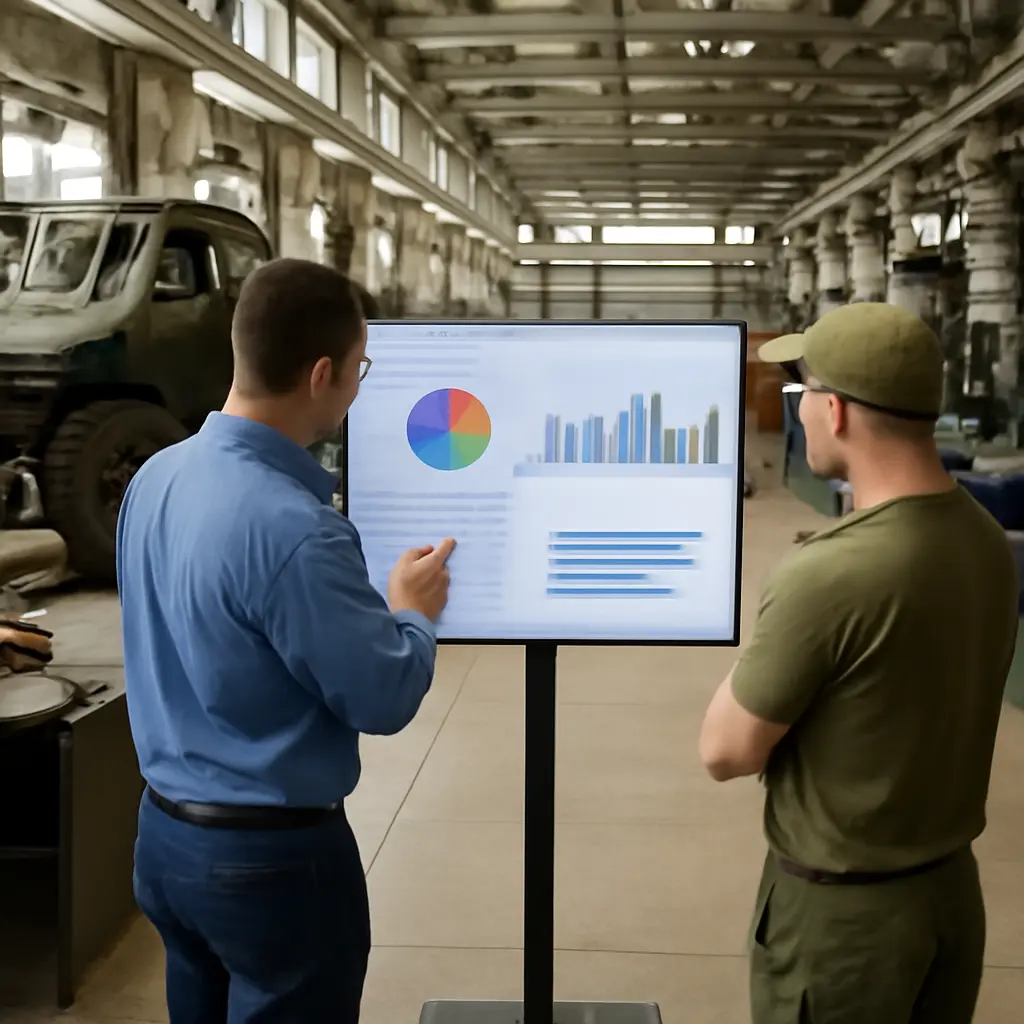
A monthly dashboard for a vehicle fleet could display a line graph of operational availability against the mission requirement, a stacked bar chart of downtime by cause, and a table of overdue safety-critical jobs and oldest backorders. A second panel could show repeat faults and maintenance cost per vehicle-kilometre. The visual should include the reporting period, denominator, target, and any material change in fleet size or usage so that leaders can interpret movement correctly.
Conclusion: Defence Maintenance Effectiveness Links Readiness to Evidence
Defence maintenance effectiveness is demonstrated when equipment is safe, reliable, available for required missions, and sustained at an acceptable lifecycle cost. Readiness and availability show the operational outcome; reliability, repair time, backlog, workforce, cost, parts supply, and data quality explain how that outcome is achieved. The strongest measurement systems define each indicator clearly, compare like with like, investigate causes, and balance targets so that short-term gains do not compromise safety or future capability.
Defence organizations should begin by auditing their metric definitions and source data, then build a mission-linked dashboard with a small number of validated indicators. Leaders can strengthen the process by reviewing downtime causes with maintainers and supply teams, testing whether improvement initiatives produce sustained results, and consulting GAO and service sustainment reports for broader context. Better measurement does not replace professional judgment; it gives decision-makers stronger evidence for protecting readiness and public resources.
Sources: U.S. Government Accountability Office, Weapon System Sustainment: Aircraft Mission Capable Rates Generally Declined from 2011 Through 2019, https://www.gao.gov/products/gao-21-101; U.S. Government Accountability Office, Weapon Systems Annual Assessment: DOD Is Not Yet Well-Positioned to Field Systems with More Predictable Outcomes, https://www.gao.gov/products/gao-23-106059; U.S. Department of Defense, Department of Defense Directive 4151.18, Maintenance of Military Materiel, https://www.esd.whs.mil/Portals/54/Documents/DD/issuances/dodd/415118p.pdf; U.S. Government Accountability Office, Weapon System Sustainment: DOD Needs to Ensure That Its Life Cycle Sustainment Plans Meet Requirements, https://www.gao.gov/products/gao-21-505t.